ESG Data
Environment
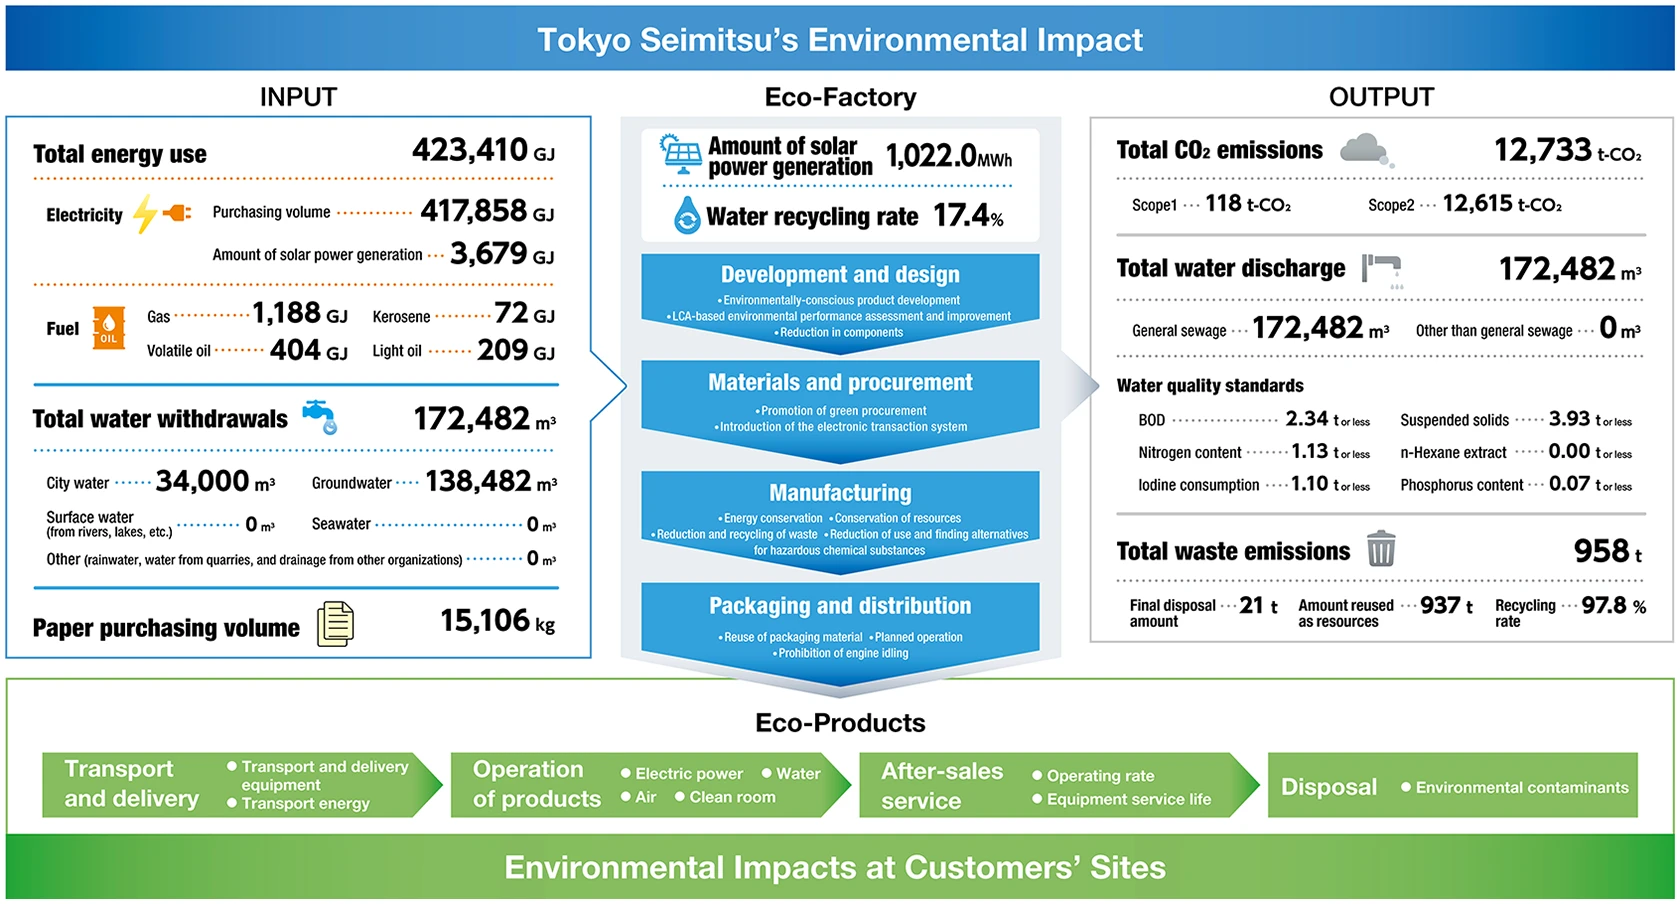
Overview of Environmental Impact in Fiscal 2024
(Locations covered: Hachioji Plant, Hanno Plant, Tsuchiura Plant, and Furudono Plant)
Covered Locations
|
Before FY2023 |
Manufacturing sites of Tokyo Seimitsu Co., Ltd. (Hachioji Plant, Hanno Plant (from completion in July 2023), Tsuchiura Plant, and Furudono Plant (from transfer of business operations in October 2023)) |
||||
|
After FY2024 |
Tokyo Seimitsu Co., Ltd. (non-consolidated basis) and consolidated subsidiaries | ||||
|
Tokyo Seimitsu Co., Ltd. |
Manufacturing sites |
Hachioji Plant, Hanno Plant, Tsuchiura Plant, and Furudono Plant | |||
|
Other |
Domestic manufacturing sites, sales offices, branches, etc. | ||||
|
Consolidated subsidiaries |
Japan |
Tosei Engineering Corp. and Tosei Box Corp. Tosei Systems Co., Ltd., Accretech Powertro System Co., Ltd., Accretech Finance Co., Ltd., and Accretech Create Co., Ltd. are located on the premises of the plants of Tokyo Seimitsu Co., Ltd. and therefore included in the manufacturing sites. |
|||
|
Overseas |
ACCRETECH AMERICA INC., ACCRETECH(EUROPE)GmbH, ACCRETECH KOREA CO.,LTD., ACCRETECH (CHINA) CO., LTD., ACCRETECH TAIWAN CO.,LTD. ACCRETECH(MALAYSIA)SDN. BHD., ACCRETECH ADAMAS(THAILAND)CO.,LTD., ACCRETECH(THAILAND)CO.,LTD., TOSEI MEASURING (PINGHU) CORP., TOSEI(THAILAND)CO.,LTD., ACCRETECH SBS INC. | ||||
Energy Use (manufacturing sites of Tokyo Seimitsu Co., Ltd. (non-consolidated basis))
|
Type |
Unit |
FY2020 |
FY2021 |
FY2022 |
FY2023 |
FY2024 |
|
|
Total energy use |
GJ |
281,133 |
289,397 |
288,544 |
365,213 |
423,410 |
|
|
MWh *1 |
29,177 |
30,253 |
29,963 |
37,920 |
44,585 |
||
|
Gas (LPG) |
GJ |
706 |
866 |
837 |
1,065 |
1,188 |
|
|
Volatile oil |
GJ |
425 |
495 |
305 |
376 |
404 |
|
|
Kerosene |
GJ |
1 |
26 |
18 |
25 |
72 |
|
|
Light oil |
GJ |
71 |
119 |
342 |
290 |
209 |
|
|
Electricity*2 |
GJ |
279,930 |
287,891 |
287,042 |
363,457 |
421,537 |
|
|
MWh |
28,843 |
29,835 |
29,546 |
37,432 |
44,065 |
||
Types of energy covered: Gas (LPG), volatile oil, kerosene, light oil, and electricity
*1 Energy other than electricity is converted from the amount of heat (GJ) to MWh (3.6 GJ/MWh)
*2 Including the amount of power generated by Tokyo Seimitsu’s solar power generation facilities
Energy Use (Tokyo Seimitsu Co., Ltd. (non-consolidated basis) and consolidated subsidiaries)
|
Type |
Target |
Unit |
FY2020 |
FY2021 |
FY2022 |
FY2023 |
FY2024 |
||
|
Total energy use (consolidated basis) |
GJ | - | - | - | - | 542,479 | |||
|
MWh*1 |
- |
- |
- |
- |
61,051 |
||||
|
Gas (LPG) |
Tokyo Seimitsu Co., Ltd. |
Manufacturing sites |
GJ |
706 |
866 |
837 |
1,065 |
1,188 |
|
|
Other*3 |
GJ |
- |
- |
- |
- |
0 |
|||
|
Consolidated subsidiaries |
Japan |
GJ |
- |
- |
- |
- |
0 |
||
|
Overseas |
GJ |
- |
- |
- |
- |
906 |
|||
|
Volatile oil |
Tokyo Seimitsu Co., Ltd. |
Manufacturing sites |
GJ |
425 |
495 |
305 |
376 | 404 | |
| Other*3*4 |
GJ |
- |
- |
- |
- | 6,321 | |||
|
Consolidated subsidiaries |
Japan |
GJ |
- |
- |
- |
- | 9,157 | ||
|
Overseas |
GJ |
- |
- |
- |
- | 5,054 | |||
|
Kerosene |
Tokyo Seimitsu Co., Ltd. |
Manufacturing sites |
GJ |
1 |
26 |
18 |
25 | 72 | |
|
Other*3 |
GJ |
- |
- |
- |
- | 0 | |||
|
Consolidated subsidiaries |
Japan |
GJ |
- |
- |
- |
- | 0 | ||
|
Overseas |
GJ |
- |
- |
- |
- | 0 | |||
|
Light oil |
Tokyo Seimitsu Co., Ltd. |
Manufacturing sites |
GJ |
71 |
119 |
342 |
290 | 209 | |
|
Other*3 |
GJ |
- |
- |
- |
- | 31 | |||
|
Consolidated subsidiaries |
Japan |
GJ |
- |
- |
- |
- | 0 | ||
|
Overseas |
GJ |
- |
- |
- |
- | 3,067 | |||
|
Electricity*2 |
Tokyo Seimitsu Co., Ltd. |
Manufacturing sites |
GJ |
279,930 |
287,891 |
287,042 |
363,457 | 421,537 | |
|
MWh |
28,843 |
29,835 |
29,546 |
37,432 | 44,065 | ||||
|
Other |
GJ |
- |
- |
- |
- | 7,533 | |||
|
MWh |
- |
- |
- |
- | 774 | ||||
|
Consolidated subsidiaries |
Japan |
GJ |
- |
- |
- |
- | 45,698 | ||
|
MWh |
- |
- |
- |
- | 4,682 | ||||
|
Overseas |
GJ |
- |
- |
- |
- | 41,302 | |||
|
MWh |
- |
- |
- |
- | 4,194 | ||||
Types of energy covered: Gas (LPG), volatile oil, kerosene, light oil, and electricity
*1 Energy other than electricity is converted from the amount of heat (GJ) to MWh (3.6 GJ/MWh)
*2 Including the amount of power generated by Tokyo Seimitsu’s solar power generation facilities
*3 Excluding sales offices and branches
*4 Including fuels used by vehicles owned by Tokyo Seimitsu Co., Ltd. (non-consolidated basis)
Introduction of Renewable Energy (manufacturing sites of Tokyo Seimitsu Co., Ltd. (non-consolidated basis))
| Type |
Unit |
FY2020 |
FY2021 |
FY2022 |
FY2023 |
FY2024 |
|||
|
Percentage of renewable electricity |
% |
15.7 |
18.5 |
29.8 |
27.5 |
43.9 | |||
|
Amount of power generated by solar power generation facilities |
GJ |
1,690 |
1,779 |
1,691 |
2,376 |
3,679 | |||
|
MWh |
469.5 |
494.2 |
469.6 |
659.9 |
1,022.0 | ||||
CO₂ Emissions (manufacturing sites of Tokyo Seimitsu Co., Ltd. (non-consolidated basis))
| Type |
Unit |
FY2020 |
FY2021 |
FY2022 |
FY2023 |
FY2024 |
||
|
Total CO₂ emissions(Scope 1 and Scope 2) |
t-CO2 | 9,524 | 8,191 | 8,257 | 11,598 | 12,733 | ||
|
Scope 1 [gas (LPG) + fuel*] |
t-CO2 | 75 | 94 | 99 | 117 | 118 | ||
| Scope 2 [location-based] | t-CO2 | 13,336 | 12,705 | 12,619 | 16,106 | 18,207 | ||
| Scope 2 [market-based] | t-CO2 | 9,449 | 8,097 | 8,158 | 11,481 | 12,615 | ||
| CO₂ emissions production volume intensity (Scope 1 and Scope 2) |
t-CO2 per million yen |
0.129 | 0.080 | 0.074 | 0.111 | 0.103 | ||
* Volatile oil, kerosene, and light oil
Scope 1: Direct GHG emissions by the Company (emissions from fuel combustion, on-site power generation, and industrial processes)
Scope 2: Indirect emissions resulting from the use of electricity and heat supplied by other companies (e.g. emissions associated with electricity purchased from electric power companies)
Location-based: The national average emission factor based on the emission factors per electricity provider (Ministry of the Environment and Ministry of Economy, Trade and Industry) is used
Market-based: The emission factor adjusted for each contracted electricity provider based on the emission factors per electricity provider (Ministry of the Environment and Ministry of Economy, Trade and Industry) is used
CO2emission production volume intensity: CO2emission per production volume unit
CO₂ Emissions (Tokyo Seimitsu Co., Ltd. (non-consolidated basis and consolidated subsidiaries))
| Type | Target |
Unit |
FY2020 |
FY2021 |
FY2022 |
FY2023 |
FY2024 |
||
| Total CO₂ emissions (consolidated basis) | t-CO2 | - | - | - | - | 18,988 | |||
| Scope1 | t-CO2 | - | - | - | - | 1,967 | |||
|
Tokyo Seimitsu Co., Ltd. |
Manufacturing sites |
t-CO2 | 75 | 94 | 99 | 117 | 118 | ||
|
Other*1*2 |
t-CO2 | - | - | - | - | 436 | |||
| Consolidated subsidiaries |
Japan |
t-CO2 | - | - | - | - | 628 | ||
|
Overseas |
t-CO2 | - | - | - | - | 786 | |||
| Scope2 | t-CO2 | - | - | - | - | 17,021 | |||
|
Tokyo Seimitsu Co., Ltd. |
Manufacturing sites |
t-CO2 | 9,449 | 8,097 | 8,158 | 11,481 | 12,615 | ||
|
Other |
t-CO2 | - | - | - | - | 331 | |||
| Consolidated subsidiaries |
Japan |
t-CO2 | - | - | - | - | 1,981 | ||
|
Overseas |
t-CO2 | - | - | - | - | 2,094 | |||
Electricity of Scope 2 is calculated using the market-based method for Tokyo Seimitsu Co., Ltd. (non-consolidated basis) and using the location-based method for consolidated subsidiaries (Japan and overseas).
Domestic CO₂ emission factor: The emission factor adjusted for each contracted electricity provider based on the emission factors per electricity provider (Ministry of the Environment and Ministry of Economy, Trade and Industry) is used
Overseas CO₂ emission factor: The emission factor published in the country or region concerned is used, along with the country-specific emission factor based on the “CO₂ EMISSIONS FROM FUEL COMBUSTION: HIGHLIGHTS (2013)” of the International Energy Agency (IEA)
*1 Excluding sales offices, branches, etc.
*2 Including fuels used by vehicles owned by Tokyo Seimitsu Co., Ltd. (non-consolidated basis)
Water Withdrawal (manufacturing sites of Tokyo Seimitsu Co., Ltd. (non-consolidated basis))
| Type |
Unit |
FY2020 |
FY2021 |
FY2022 |
FY2023 |
FY2024 |
|
| Total quantity of water withdrawal | m³ |
169,873 |
163,662 |
164,150 |
168,685 |
172,482 | |
|
City water supply |
m³ |
20,818 |
22,144 |
21,989 |
32,721 |
34,000 | |
|
Groundwater |
m³ |
149,055 |
141,518 |
142,161 |
135,964 |
138,482 | |
|
Surface water(from rivers, lakes) |
m³ |
- |
0 |
0 |
0 |
0 |
|
|
Seawater |
m³ |
- |
0 | 0 | 0 | 0 | |
|
Other(rainwater, water from quarries, and drainage from other organizations) |
m³ |
- |
0 |
0 |
0 |
0 |
|
|
Water withdrawal production volume intensity |
m³/million yen |
2.29 |
1.61 |
1.48 |
1.59 |
1.39 |
|
Water Withdrawal (Tokyo Seimitsu Co., Ltd. (non-consolidated basis) and consolidated subsidiaries)
| Type | Target |
Unit |
FY2020 |
FY2021 |
FY2022 |
FY2023 |
FY2024 |
||
| Total water withdrawal (consolidated basis) | m³ |
- |
- |
- |
- |
214,028 | |||
|
City water supply |
Tokyo Seimitsu Co., Ltd. |
Manufacturing sites |
m³ |
20,818 |
22,144 |
21,989 |
32,721 |
34,000 | |
|
Other |
m³ |
- |
- |
- |
- |
1,296 |
|||
|
Consolidated subsidiaries |
Japan |
m³ |
- |
- |
- |
- |
13,329 |
||
|
Overseas |
m³ |
- |
- |
- |
- |
24,067 |
|||
|
Groundwater |
Tokyo Seimitsu Co., Ltd. |
Manufacturing sites |
m³ |
149,055 |
141,518 |
142,161 |
135,964 |
138,482 | |
|
Other |
m³ |
- |
- |
- |
- |
0 |
|||
|
Consolidated subsidiaries |
Japan |
m³ |
- |
- |
- |
- |
0 |
||
|
Overseas |
m³ |
- |
- |
- |
- |
0 |
|||
|
Surface water |
Tokyo Seimitsu Co., Ltd. |
Manufacturing sites |
m³ |
- |
0 |
0 |
0 |
0 |
|
|
Other |
m³ |
- |
- |
- |
- |
0 |
|||
|
Consolidated subsidiaries |
Japan |
m³ |
- |
- |
- |
- |
0 |
||
|
Overseas |
m³ |
- |
- |
- |
- |
2,662 |
|||
|
Seawater |
Tokyo Seimitsu Co., Ltd. |
Manufacturing sites |
m³ |
- |
0 |
0 |
0 |
0 |
|
|
Other |
m³ |
- |
- |
- |
- |
0 |
|||
|
Consolidated subsidiaries |
Japan |
m³ |
- |
- |
- |
- |
0 |
||
|
Overseas |
m³ |
- |
- |
- |
- |
0 |
|||
|
Other |
Tokyo Seimitsu Co., Ltd. |
Manufacturing sites |
m³ |
- |
0 |
0 |
0 |
0 |
|
|
Other |
m³ |
- |
- |
- |
- |
0 |
|||
|
Consolidated subsidiaries |
Japan |
m³ |
- |
- |
- |
- |
0 |
||
| Overseas | m³ |
- |
- |
- |
- |
192 | |||
Water discharge (manufacturing sites of Tokyo Seimitsu Co., Ltd. (non-consolidated basis))
|
Type |
Unit |
FY2020 |
FY2021 |
FY2022 |
FY2023 |
FY2024 |
|
|
Total water discharge |
m³ |
169,873 |
163,662 |
164,150 |
168,685 | 172,482 | |
|
Industrial water discharge(general sewage) |
m³ |
169,873 |
163,662 |
164,150 |
168,685 | 172,482 | |
|
Effluent other than industrial water discharge |
m³ |
0 |
0 |
0 |
0 |
0 | |
|
Water Quality Standards* |
|||||||
|
BOD |
t or less |
2.75 |
1.87 |
2.76 |
2.77 |
2.34 | |
|
Nitrogen content |
t or less |
1.31 |
1.34 |
1.44 |
1.56 |
1.13 | |
|
Iodine consumption |
t or less |
0.71 |
0.82 |
0.81 |
0.73 |
1.10 | |
|
Suspended solids |
t or less |
5.49 |
3.21 |
3.78 |
3.96 |
3.93 | |
|
Amount of n-Hexane extract |
t or less |
0.02 |
0.02 |
0.05 |
0.37 |
0.00 | |
|
Phosphorus content |
t or less |
0.06 |
0.06 |
0.07 |
0.08 |
0.07 | |
*Hachioji Plant, Tokyo Seimitsu Co., Ltd. (non-consolidated basis)
All effluent is treated as general sewage
Water discharge(Tokyo Seimitsu Co., Ltd. (non-consolidated basis) and consolidated subsidiaries)
| Type | Target |
Unit |
FY2020 |
FY2021 |
FY2022 |
FY2023 |
FY2024 |
||
| Total water discharge(consolidated basis) | m³ |
- |
- |
- |
- |
201,570 | |||
|
Industrial water discharge |
Tokyo Seimitsu Co., Ltd. |
Manufacturing sites |
m³ |
169,873 |
163,662 |
164,150 |
168,685 | 172,482 | |
|
Other* |
m³ |
- |
- |
- |
- |
1,296 | |||
|
Consolidated subsidiaries |
Japan |
m³ |
- |
- |
- |
- |
13,329 | ||
|
Overseas |
m³ |
- |
- |
- |
- |
14,463 | |||
|
Effluent other than industrial water discharge |
Tokyo Seimitsu Co., Ltd. |
Manufacturing sites |
m³ |
0 |
0 |
0 |
0 |
0 | |
|
Other |
m³ |
- |
- |
- |
- |
0 | |||
|
Consolidated subsidiaries |
Japan |
m³ |
- |
- |
- |
- |
0 | ||
|
Overseas |
m³ |
- |
- |
- |
- |
0 | |||
* Excluding sales offices, branches, etc.
Water Recycling (manufacturing sites of Tokyo Seimitsu Co., Ltd. (non-consolidated basis))
|
Type |
Unit |
FY2020 |
FY2021 |
FY2022*2 |
FY2023 |
FY2024 |
| Water recycling rate from pure water production facilities*1 | % | 17.2 | 17.2 | 17.7 | 17.1 | 17.4 |
*1 Hachioji Plant, Tokyo Seimitsu Co., Ltd.
*2 Corrected due to a rounding operation mistake.
Paper Purchasing Volume (manufacturing sites of Tokyo Seimitsu Co., Ltd. (non-consolidated basis))
|
Type |
Unit |
FY2020 |
FY2021 |
FY2022 |
FY2023 |
FY2024 |
|
Total paper purchasing volume |
kg |
28,622 |
34,234 |
34,489 |
24,389 | 15,106 |
|
Paper purchasing volume production volume intensity* |
kg/million yen |
0.386 |
0.337 |
0.310 |
0.233 |
0.122 |
* Paper purchasing volume production volume intensity: Total paper purchasing volume at the manufacturing site/total production volume at the manufacturing site (million yen)
Paper Purchasing Volume (Tokyo Seimitsu Co., Ltd. (non-consolidated basis) and consolidated subsidiaries)
|
Type |
Target |
Unit |
FY2020 |
FY2021 |
FY2022 |
FY2023 |
FY2024 | |
|
Total paper purchasing volume |
kg |
- |
- |
- |
- |
38,477 | ||
|
Tokyo Seimitsu Co., Ltd. |
Manufacturing sites |
kg |
28,622 |
34,234 |
34,489 |
24,389 | 15,106 | |
|
Other |
kg |
- |
- |
- |
- |
9,397 | ||
|
Consolidated subsidiaries |
Japan |
kg |
- |
- |
- |
- |
9,293 |
|
|
Overseas |
kg |
- |
- |
- |
- |
4,681 |
||
Waste Emissions (manufacturing sites of Tokyo Seimitsu Co., Ltd. (non-consolidated basis))
|
Type |
Unit |
FY2020 |
FY2021 |
FY2022 |
FY2023 |
FY2024 | |
|
Total waste emissions |
t |
871 |
990 |
1,071 |
1,008 |
958 | |
|
Metal scraps |
t |
- |
302 |
286 |
333 |
329 | |
|
Waste paper |
t |
- |
218 | 228 | 182 |
197 |
|
|
Waste woods |
t |
- |
188 | 204 | 178 | 151 | |
|
Glass wastes |
t |
- |
68 | 113 | 57 | 14 | |
|
Plastic wastes |
t |
- |
96 | 88 | 90 | 86 | |
|
Waste liquids |
t |
- |
57 | 64 | 54 | 57 | |
|
Sludge |
t |
- |
37 | 36 | 66 | 86 | |
|
General industrial wastes |
t |
- |
9 | 9 | 37 | 31 | |
|
Non-combustible waste |
t |
- |
3 | 6 | 4 | 3 | |
|
Wire scraps and office appliances |
t |
- |
12 | 10 | 8 | 3 | |
|
Amount reused as resources |
t |
858 |
975 |
1,061 |
991 |
937 | |
|
Final disposal amount |
t |
13 |
14 |
10 |
17 |
21 | |
|
Recycling rate |
% |
98.5 |
98.5 |
99.0 |
98.4 |
97.8 | |
Furudono Plant (business operations transferred in October 2023) is not included only in the data for fiscal 2023.
Waste Emissions (Tokyo Seimitsu Co., Ltd. (non-consolidated basis) and consolidated subsidiaries)
|
Type |
Unit |
単位 |
FY2020 |
FY2021 |
FY2022 |
FY2023 |
FY2024 | |
|
Total waste emissions |
t |
- |
- |
- |
- |
1,398 | ||
|
Tokyo Seimitsu Co., Ltd. |
Manufacturing sites |
t |
871 |
990 |
1,071 |
1,008 |
958 | |
|
Other |
t |
- |
- |
- |
- |
82 |
||
| Consolidated subsidiaries |
Japan |
t |
- |
- |
- |
- |
285 | |
|
Overseas |
t |
- |
- |
- |
- |
73 | ||
Society
Covered Locations
|
Before FY2023 |
Manufacturing sites of Tokyo Seimitsu Co., Ltd. (Hachioji Plant, Hanno Plant (from completion in July 2023), Tsuchiura Plant, and Furudono Plant (from transfer of business operations in October 2023)) |
||||
|
After FY2024 |
Tokyo Seimitsu Co., Ltd. (non-consolidated basis) and consolidated subsidiaries | ||||
|
Tokyo Seimitsu Co., Ltd. |
Manufacturing sites |
Hachioji Plant, Hanno Plant, Tsuchiura Plant, and Furudono Plant | |||
|
Other |
Domestic manufacturing sites, sales offices, branches, etc. | ||||
|
Consolidated subsidiaries |
Japan |
Tosei Engineering Corp. and Tosei Box Corp. Tosei Systems Co., Ltd., Accretech Powertro System Co., Ltd., Accretech Finance Co., Ltd., and Accretech Create Co., Ltd. are located on the premises of the plants of Tokyo Seimitsu Co., Ltd. and therefore included in the manufacturing sites. |
|||
|
Overseas |
ACCRETECH AMERICA INC., ACCRETECH(EUROPE)GmbH, ACCRETECH KOREA CO.,LTD., ACCRETECH (CHINA) CO., LTD., ACCRETECH TAIWAN CO.,LTD. ACCRETECH(MALAYSIA)SDN. BHD., ACCRETECH ADAMAS(THAILAND)CO.,LTD., ACCRETECH(THAILAND)CO.,LTD., TOSEI MEASURING (PINGHU) CORP., TOSEI(THAILAND)CO.,LTD., ACCRETECH SBS INC. | ||||
Consolidated Employee Overview
(data provided was current as of March 31 of the relevant fiscal year)
Number of Employees (Tokyo Seimitsu Co., Ltd. and consolidated subsidiaries)
| Unit |
FY2020 |
FY2021 |
FY2022 |
FY2023 |
FY2024 |
||||
|
Total number of employees*1 |
Persons |
3,289 |
3,477 |
3,726 |
3,211 | 3,333 | |||
|
|
Total number of regular employees |
Persons |
2,293 |
2,354 |
2,468 |
2,658 | 2,767 | ||
| Gender |
Men |
Persons |
- |
- |
- |
2,259 | 2,351 | ||
| Women | Persons |
- |
- |
- |
399 | 416 | |||
|
Percentage of females |
% |
- |
- |
- |
15.0 | 15.0 | |||
| Age*3 |
Under 30 |
Persons |
- |
- |
- |
587 |
635 | ||
| 30 to 50 | Persons |
- |
- |
- |
1,527 |
1,553 | |||
|
50 or older |
Persons |
- |
- |
- |
544 |
579 | |||
| By region | Japan | Persons |
1,584 |
1,634 |
1,718 |
1,831 | 1,943 | ||
|
Other countries in Asia |
Persons |
583 |
592 |
598 |
644 | 643 | |||
|
Europe |
Persons |
72 |
78 |
92 |
94 | 95 | |||
|
North America/South America |
Persons |
54 |
50 |
60 |
89 | 86 | |||
|
By industry sector |
Semiconductor manufacturing equipment | Persons |
1,240 |
1,304 |
1,355 |
1,463 | 1,564 | ||
|
Measuring instruments |
Persons |
881 |
880 |
924 |
983 | 986 | |||
|
Regular employees who work for both the Semiconductor Company and Metrology Company |
Persons |
172 |
170 |
189 |
212 | 217 | |||
| Total number of temporary workers*2 | Persons |
996 |
1,123 |
1,258 |
553 | 566 | |||
| Tokyo Seimitsu Co., Ltd. (non-consolidated basis)*1 |
Persons |
1,555 |
1,704 |
1,837 |
1,523 | 1,629 | |||
| Number of regular employees | Persons |
944 |
922 |
1,054 |
1,200 | 1,292 | |||
| Number of temporary workers*2 | Persons |
611 |
721 |
783 |
323 | 337 | |||
| Consolidated subsidiaries*1 |
Persons |
1,734 |
1,773 |
1,889 |
1,688 | 1,704 | |||
| Number of regular employees | Persons |
1,349 |
1,432 |
1,414 |
1,458 | 1,475 | |||
| Number of temporary workers*2 | Persons |
385 |
411 |
475 |
230 | 229 | |||
*1 From fiscal 2023, the number of employees will be the one of workers directly employed by the Company only, and temporary employees will be excluded.
*2 From fiscal 2023, temporary employees will be excluded.
Recruitment/Turnover of Regular Employees (Tokyo Seimitsu Co., Ltd. and consolidated subsidiaries)
|
Unit |
FY2020 |
FY2021 |
FY2022 |
FY2023 |
FY2024 |
|||
| Total number of new graduates recruited as regular employees |
Persons |
- |
- |
- |
122 |
108 | ||
| Gender |
Men |
Persons |
- |
- |
- |
100 |
91 | |
| Women | Persons |
- |
- |
- |
22 |
17 | ||
| Percentage of females | % |
- |
- |
- |
18.0 |
15.7 | ||
|
Total number of mid-career hires serving as regular employees (including those who were promoted to become regular employees) |
Persons |
- |
- |
- |
203 |
167 | ||
| Gender |
Men |
Persons |
- |
- |
- |
144 |
129 | |
| Women | Persons |
- |
- |
- |
59 |
38 | ||
| Percentage of females | % |
- |
- |
- |
29.1 |
22.8 | ||
| Percentage of female regular employee hires | % |
- |
- |
- |
24.9 |
20.0 | ||
| Number of employees who left the Company*1 | Persons |
- |
- |
- |
123 |
147 | ||
| Turnover rate*2 | % |
- |
- |
- |
4.6 |
5.3 | ||
*¹ Number of regular employees (including mandatory retirement) who left their jobs during the reporting period (between April 1 and March 31 of each year) Note: Excluding employees that were re-employed
*² Calculated as the number of employees who left their jobs within the fiscal year divided by the number of employees employed at the end of the fiscal year multiplied by 100%
Female Managers (Tokyo Seimitsu Co., Ltd. and consolidated subsidiaries)
|
Unit |
FY2020 |
FY2021 |
FY2022 |
FY2023 |
FY2024 |
||||
| Number of female managers |
Persons |
- | - | 27 | 28 | 29 | |||
| Percentage of female managers |
% |
- | - | 5.9 | 5.8 | 6.0 | |||
Number of Employees by Employment Type (Japan: Tokyo Seimitsu Co., Ltd. and consolidated subsidiaries (Japan))
|
Unit |
FY2020 |
FY2021 |
FY2022 |
FY2023 |
FY2024 |
||||
| Total number of employees*1 |
Persons |
2,582 | 2,765 | 2,898 | 2,364 | 2,489 | |||
|
Total number of regular employees |
Persons |
1,584 | 1,634 | 1,718 | 1,831 | 1,943 | |||
| Gender |
Men |
Persons |
- |
- |
- |
1,650 | 1,727 | ||
| Women | Persons |
- |
- |
- |
181 | 216 | |||
| Percentage of females | % |
- |
- |
- |
9.9 | 11.1 | |||
| Age*3 |
Under 30 |
Persons |
- |
- |
- |
477 | 525 | ||
| 30 to 50 | Persons |
- |
- |
- |
943 | 982 | |||
| 50 or older | Persons |
- |
- |
- |
441 | 436 | |||
| Number of temporary workers*2 | Persons | 998 | 1,131 | 1,180 | 553 | 546 | |||
*1 From fiscal 2023, the number of employees will be the one of workers directly employed by the Company only, and temporary employees will be excluded.
*2 From fiscal 2023, temporary employees will be excluded.
*3 Based on ages as of the end of the reporting period (March 31 of each year)
Female Managers (Japan: Tokyo Seimitsu Co., Ltd. and consolidated subsidiaries (Japan))
|
Unit |
FY2020 |
FY2021 |
FY2022 |
FY2023 |
FY2024 |
||||
| Number of female managers |
Persons |
- | - | 5 | 5 | 6 | |||
| Percentage of female managers |
% |
- | - | 1.7 | 1.6 | 2.0 | |||
Overview of Tokyo Seimitsu Co., Ltd. (non-consolidated basis)
(data provided was current as of March 31 of the relevant fiscal year)
Composition of Regular Employees
|
Unit |
FY2020 |
FY2021 |
FY2022 |
FY2023* |
FY2024 |
|||
| Percentage of female regular employees | % | 6.4 | 7.4 | 8.5 | 10.2 | 11.3 | ||
| Gender*¹ |
Men |
Persons |
- |
- |
- |
1,078 | 1,146 | |
|
Women |
Persons |
- |
- |
- |
122 | 146 | ||
|
Average age of regular employees |
Age |
39.9 |
39.8 |
39.6 |
39.2 | 38.9 | ||
| Age*² |
Under 30 |
Persons |
- |
- |
- |
330 | 377 | |
|
30 to 50 |
Persons |
- |
- |
- |
550 | 566 | ||
|
50 or older |
Persons |
- |
- |
- |
320 | 349 | ||
| Average years of service for regular employees |
Years |
11.2 |
11.1 |
11.1 |
10.2 | 10.1 | ||
| Gender |
Men |
Years |
11.4 |
11.4 |
11.5 |
10.6 | 10.5 | |
|
Women |
Years |
7.8 |
7.5 |
7.3 |
6.3 | 6.4 | ||
|
Percentage of difference in average years of service between females and males |
% |
- 31.6 |
- 34.2 |
- 36.5 |
- 40.6 | - 39.0 | ||
*¹Excludes our employees stationed to other companies; includes employees of other companies stationed at our companies
*²Recalculated by subtracting those employees stationed to other companies from the target of calculation by gender.
Female Managers
|
|
Unit |
FY2020 |
FY2021 |
FY2022 |
FY2023 |
FY2024 |
|
Percentage of female managers |
% |
1.5 |
1.9 |
2.4 |
2.1 |
2.6 |
Recruitment/Employment Data
|
Unit |
FY2020 |
FY2021 |
FY2022 |
FY2023 |
FY2024 |
|||
|
Total number of new graduates recruited as regular employees |
Persons |
43 |
44 |
56 |
79 | 70 | ||
|
Gender |
Men |
Persons |
40 |
34 |
45 |
65 | 59 | |
|
Women |
Persons |
3 |
10 |
11 |
14 | 11 | ||
|
Percentage of females |
% |
7.0 |
22.7 |
19.6 |
17.7 | 15.7 | ||
|
Total number of mid-career hires serving as regular employees (including those who were promoted to become regular employees) |
Persons |
39 |
50 |
59 |
52 | 67 | ||
|
Gender |
Men |
Persons |
37 |
44 |
49 |
37 | 48 | |
|
Women |
Persons |
2 |
6 |
10 |
15 | 19 | ||
|
Percentage of females |
% |
5.1 |
12.0 |
16.9 |
28.8 | 28.4 | ||
|
Percentage of female regular employee hires |
% |
6.1 |
17.0 |
18.3 |
22.1 | 21.9 | ||
Regular Employee Retention/Turnover
|
|
Unit |
FY2020 |
FY2021 |
FY2022 |
FY2023 |
FY2024 |
|
New graduate retention rate (three years after entering the Company) |
% |
90.9 |
87.7 |
88.4 |
95.5 | 91.2 |
|
Number of employees who left the Company*¹ |
Persons |
33 |
43 |
42 |
48 | 45 |
|
Turnover rate*² |
% |
3.3 |
4.1 |
3.7 |
4.0 | 3.5 |
*¹ Number of regular employees (including mandatory retirement) who left their jobs during the reporting period (between April 1 and March 31 of each year) Note: Excluding employees that were re-employed
*² Calculated using the following formula after fiscal 2023:
Number of employees who have left their jobs within the fiscal year divided by the number of employees at the company at the end of the fiscal year multiplied by 100%
Calculated using the following formula in fiscal 2022 and previous fiscal years:
Number of employees who have left their jobs within the fiscal year divided by the number of employees at the company on the first day of the following fiscal year multiplied by 100%
Employment of Persons with Disabilities
|
|
Unit |
FY2020 |
FY2021 |
FY2022 |
FY2023 |
FY2024 |
FY2025 |
| Percentage of employment of persons with disabilities* |
% |
1.94 |
1.95 |
2.07 |
2.17 |
2.39 |
2.43 |
* Data depicted in the table are current as of June 1 of each year. The “Act to Facilitate the Employment of Persons with Disabilities” stipulates that employment of one individual with a serious disability is equivalent to employing “two individuals” for purposes of calculating the number of associates with disabilities and percentage of employment
Re-Employment System
|
Unit |
FY2020 |
FY2021 |
FY2022 |
FY2023 |
FY2024 |
|||
|
Number of system users |
Persons |
7 |
10 |
20 |
25 |
24 | ||
|
Gender |
Men |
Persons |
7 |
10 |
20 |
24 |
22 | |
|
Women |
Persons |
0 |
0 |
0 |
1 |
2 | ||
|
Re-employment rate (annual) |
% |
58.3 |
71.4 |
69.0 |
89.3 |
80.0 | ||
Annual Paid Leave
|
|
Unit |
FY2020 |
FY2021 |
FY2022 |
FY2023 |
FY2024 |
|
Acquisition rate |
% |
65.9 |
69.8 |
76.7 |
72.3 |
71.9 |
|
Rate of taking five or more days of annual paid leave |
% |
100 |
100 |
100 |
100 |
100 |
|
Average number of days of leave taken |
Days |
12.2 |
13.1 |
14.5 |
13.8 |
13.7 |
Refreshment Leave
|
Unit |
FY2020 |
FY2021 |
FY2022 |
FY2023 |
FY2024 |
|||
|
Number of employees taking refreshment leave |
Persons |
6 |
14 |
34 |
22 |
33 | ||
|
Gender |
Men |
Persons |
6 |
13 |
33 |
22 |
31 | |
|
Women |
Persons |
0 |
1 |
1 |
0 |
2 | ||
Childcare Leave/Short-Term Childcare Leave
|
Unit |
FY2020 |
FY2021 |
FY2022 |
FY2023 |
FY2024 |
|||
| Number of employees taking childcare leave | Persons | 5 | 5 | 12 | 17 | 16 | ||
| Gender | Men | Persons | 3 | 5 | 10 | 16 | 13 | |
| Women | Persons | 2 | 0 | 2 | 1 | 3 | ||
| Number of employees eligible to take childcare leave | Persons | 34 | 26 | 28 | 29 | 27 | ||
| Gender | Men | Persons | 32 | 26 | 26 | 28 | 24 | |
| Women | Persons | 2 | 0 | 2 | 1 | 3 | ||
| Childcare leave acquisition rate | % | 14.7 | 19.2 | 42.9 | 58.6 | 59.3 | ||
| Gender | Men | % | 9.4 | 19.2 | 38.5 | 57.1 | 54.2 | |
| Women | % | 100 | None eligible | 100 | 100 | 100 | ||
| Number of employees who return to work after taking childcare leave | Persons | 2 | 7 | 10 | 16 | 13 | ||
| Gender | Men | Persons | 2 | 6 | 9 | 15 | 11 | |
| Women | Persons | 0 | 1 | 1 | 1 | 2 | ||
| Return to work rate | % | 100 | 100 | 100 | 100 | 93.3 | ||
| Retention rate | % | 100 | 85.7 | 100 | 100 | 100 | ||
| Number of employees taking short-term child-nursing leave | Persons | 4 | 7 | 11 | 16 | 18 | ||
| Gender | Men | Persons | 0 | 1 | 4 | 6 | 8 | |
| Women | Persons | 4 | 6 | 7 | 10 | 10 | ||
Nursing Care Leave/Short-Term Nursing Care Leave
|
Unit |
FY2020 |
FY2021 |
FY2022 |
FY2023 |
FY2024 |
|||
|
Number of employees taking nursing care leave |
Persons |
1 |
0 |
0 |
0 |
0 | ||
|
Gender |
Men |
Persons |
1 |
0 |
0 |
0 |
0 | |
|
Women |
Persons |
0 |
0 |
0 |
0 |
0 | ||
|
Number of employees taking short-term nursing care leave |
Persons |
1 |
4 |
9 |
12 |
15 | ||
|
Gender |
Men |
Persons |
0 |
0 |
3 |
3 |
4 | |
|
Women |
Persons |
1 |
4 |
6 |
9 |
11 | ||
Employee Education/Training
|
Unit |
FY2020 |
FY2021 |
FY2022 |
FY2023 |
FY2024 |
|||
|
Total training hours |
Hours | 3,385.1 | 6,445.9 | 9,938.7 | 14,992.9 | 14,668.2 | ||
|
Total hours of common training |
Hours | 1,614.5 | 2,202.3 | 2,877.6 | 4,686.2 | 4,676.8 | ||
|
Human resource development training |
Hours | - | - | 357.8 | 1,624.6 | 1,541.9 | ||
|
360-degree feedback review training |
Hours |
- |
345.0 |
576.0 |
639.0 |
703.5 | ||
|
E-learning |
Hours |
1,614.5 |
1,857.3 |
1,943.8 |
2,422.6 |
2431.4 | ||
|
Total hours of level-specific training |
Hours |
1,770.6 |
4,243.7 |
7,061.1 |
10,306.8 |
9,991.4 | ||
|
New employee training |
Hours |
989.4 |
3,374.8 |
5,683.5 |
6,059.3 |
6442.8 | ||
|
New employee follow-up training |
Hours |
172.0 |
176.0 |
285.0 |
333.0 |
401.1 | ||
|
Training for new managers |
Hours |
87.0 |
45.0 |
212.7 |
164.4 |
87.0 | ||
|
Training for new section chiefs |
Hours |
232.1 |
193.4 |
348.1 |
338.5 |
319.1 | ||
|
Training for new assistant section chiefs |
Hours |
290.1 |
454.5 |
444.8 |
406.1 |
406.1 | ||
|
Training for managers |
Hours |
Canceled* |
Canceled* |
Canceled* |
1,848.5 |
1955.9 | ||
|
Career training for female regular employees |
Hours |
- |
- |
87.0 |
938.0 |
- | ||
|
Design thinking training |
Hours |
- |
- |
- |
- |
277.4 | ||
|
Life planning seminar |
Hours |
- |
- |
- |
219.0 |
102.0 | ||
|
Average number of training hours per person |
Hours |
3.6 |
7.0 |
9.4 |
12.5 |
11.4 | ||
|
Total number of attendees |
Persons |
149 |
170 |
264 |
971 |
916 | ||
|
Education investment per person |
Yen |
22,432.3 |
29,415.3 |
35,576.5 |
41,981.4 |
40,909.3 | ||
* Canceled to prevent the spread of COVID-19
Safety
Frequency Rate for Accidents Resulting in Leave*¹
|
Unit |
FY2020 |
FY2021 |
FY2022 |
FY2023 |
FY2024 |
||
| All industries*² | % | 1.95 | 2.09 | 2.06 | 2.14 | 2.10 | |
|
Average for manufacturing companies in Japan*² |
% |
1.21 |
1.31 |
1.25 |
1.29 |
1.30 | |
|
Electrical machinery and equipment manufacturing companies*² |
% |
0.52 |
0.54 |
0.53 |
0.54 |
0.67 | |
|
Tokyo Seimitsu Co., Ltd. |
% |
0.00 |
0.53 |
0.26 |
0.99 |
0.47 | |
|
Semiconductor Company/Administration Company |
% |
0.00 |
0.66 |
0.33 |
0.94 |
0.59 | |
|
Metrology Company |
% |
0.00 |
0.00 |
0.00 |
1.15 |
0.00 | |
*¹ Frequency rate:Indicates the frequency of injury or death due to occupational accidents
Formula: (Casualties/total hours worked) × 1,000,000
*¹ Ministry of Health, Labour and Welfare (Survey on Industrial Accidents)
Severity Rate for Accidents Resulting in Leave*¹
|
Unit |
FY2020 |
FY2021 |
FY2022 |
FY2023 |
FY2024 |
||
| All industries*² | % | 0.09 | 0.09 | 0.09 | 0.09 | 0.09 | |
|
Average for manufacturing companies in Japan*² |
% |
0.07 |
0.06 |
0.08 |
0.08 |
0.06 | |
|
Electrical machinery and equipment manufacturing companies*² |
% |
0.05 |
0.01 |
0.02 |
0.01 |
0.03 | |
|
Tokyo Seimitsu Co., Ltd. |
% |
0.000 |
0.040 |
0.000 |
0.008 |
0.000 | |
|
Semiconductor Company/Administration Company |
% |
0.000 |
0.050 |
0.000 |
0.002 |
0.001 | |
|
Metrology Company |
% |
0.000 |
0.000 |
0.000 |
0.031 |
0.000 | |
*¹ Severity rate: Percentage of the degree of loss caused by occupational
accidents Formula: (Total lost workdays/total hours worked) × 1,000
*² Ministry of Health, Labour and Welfare (Survey on Industrial Accidents)
Governance
Governance
|
|
Unit |
FY2020 |
FY2021 |
FY2022 |
FY2023 |
FY2024 |
|
Total number of serious concerns reported to the Board of Directors |
Number |
1 |
0 |
0 |
0 |
0 |
|
Total number of cases resulting in legal action due to anticompetitive behavior and antitrust violations in which the organization was found to be involved |
Number |
0 |
0 |
0 |
0 |
0 |
|
Expenditures for political organizations |
Yen |
0 |
0 |
0 |
0 |
0 |
|
Average number of years directors spend in office |
Years |
8.54 |
8.38 |
8.85 |
8.50 |
7.91 |
|
Average Board of Directors’ Meeting attendance rate |
% |
99.57 |
100.00 |
99.55 |
100.0 |
99.48 |
Compliance
|
|
Unit |
FY2020 |
FY2021 |
FY2022 |
FY2023 |
FY2024 |
|
Ethical standards education and commitment follow through rate |
% |
100.0 |
100.0 |
100.0 |
100.0 |
100.0 |
|
Percentage of agreements found to comply with information security protocols |
% |
100.0 |
100.0 |
100.0 |
100.0 |
100.0 |
|
Total number of sanctions received by the organization for noncompliance with laws and regulations in the socioeconomic sector |
Number |
0 |
0 |
0 |
0 |
0 |
Environment・Society・Governance