Water Resources
Water is a valuable resource that is directly linked to people's lives and livelihoods. Since the Hachioji Plant, which manufactures semiconductor manufacturing equipment, uses a large amount of water (pure water), we are working to conserve water resources by reducing water consumption and promoting water recycling.
Eco-Factory
Fiscal 2024 Targets and Results
|
Objectives |
Plans/Targets | Result (FY2024) |
| Reduction of water consumption (Water consumption production volume intensity reduction) |
Plan By FY2024, reduce water consumption by 5% from FY2019 levels Year set 2020 Period FY2020 to FY2024 Benchmark usage 2.74m³/million yen Reduction target 2.60m³/million yen |
1.39m³/million yen (49.1% reduction compared to FY2019) |
Locations covered: Tokyo Seimitsu Co., Ltd. Hachioji Plant, Hanno Plant, Tsuchiura Plant, and Furudono Plant
Reduction of Water Consumption and Water Recycling
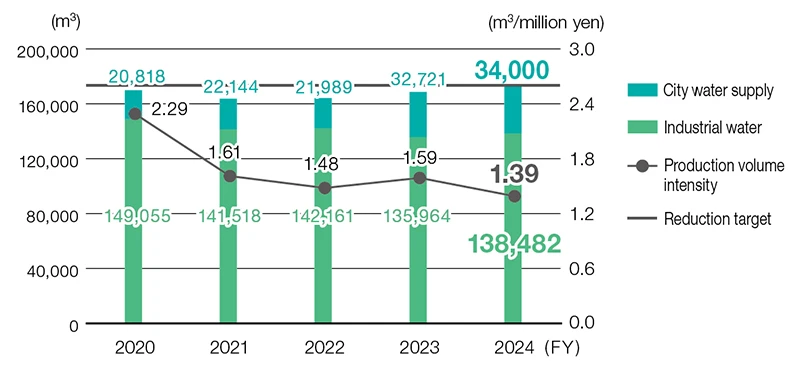
All of the water withdrawals are provided using city water and groundwater. In fiscal 2024, we used 172,482 m³ of water. At the Hachioji Plant in particular, wastewater volumes are increasing as the production volume of semiconductor manufacturing equipment that uses a large amount of water (pure water) increases. As a result, a portion of the wastewater is collected and filtered to promote water recycling as raw water to serve as pure water. We save water by monitoring water consumption using flow sensors installed to measure the amount of water passing through pipes. We also manage water resources appropriately.
Quantity of Water Withdrawal (Water Usage)
| Unit | FY2020 | FY2021 | FY2022 | FY2023 | FY2024 | |
| Quantity of water withdrawal | m³ | 169,873 | 163,662 | 164,150 | 168,685 | 172,482 |
| City water | m³ | 20,818 | 22,144 | 21,989 | 32,721 | 34,000 |
| Ground water | m³ | 149,055 | 141,518 | 142,161 | 135,964 | 138,482 |
| Other* | m³ | 0 | 0 | 0 | 0 | 0 |
|
Water usage production volume intensity |
m³/million yen | 2.29 | 1.61 | 1.48 | 1.59 | 1.39 |
Locations covered: Tokyo Seimitsu Co., Ltd. Hachioji Plant, Hanno Plant, Tsuchiura Plant, and Furudono Plant The results for fiscal 2023 include data from July onward for the Hanno Plant, when construction of the plant was completed, and from October onward for the Furudono Plant to which operations were transferred.
* Other: Includes surface water (rivers, lakes, etc.), seawater, rainwater, drainage from other organizations, etc.
Quantity of Water Withdrawal

Water Recycling Rate*¹ from Pure Water Production Facilities
| Unit | FY2020 | FY2021 | FY2022*² | FY2023 | FY2024 | |
| Water Recycling Rate*¹ from Pure Water Production Facilities | % | 17.2 | 17.2 | 17.7 | 17.1 | 17.4 |
Locations covered: Tokyo Seimitsu Co., Ltd. Hachioji Plant
*1 Water recycling rate: Amount recycled/amount used (= raw water input + amount recycled)
*2 Corrected due to a rounding operation mistake.
Water Risk Assessment
Water stress and water risk are assessed using the World Resources Institute Aqueduct Overall Water Risk Map. The areas where our production plants (Hachioji, Hanno, Tsuchiura, and Furudono) and the production plants of domestic Group companies are located are regions indicated as having “low to medium” water risk. On the other hand, some of the manufacturing sites of overseas subsidiaries are located in regions indicated as having “extremely high” or “high” water risk. In Japan, we will continue to monitor water stress periodically while using hazard maps created by local governments.
Water Quality Standards
Since all of our wastewater is general sewage, none of it is discharged into ocean waters or rivers. We thoroughly conduct wastewater management at each factory to preserve the water environment.
Water Quality Standards
| Unit | FY2020 | FY2021 | FY2022 | FY2023 | FY2024 | |
| BOD | t | 2.75 or less | 1.87 or less | 2.76 or less | 2.77 or less | 2.34 or less |
| Nitrogen content | t | 1.31 or less | 1.34 or less | 1.44 or less | 1.56 or less | 1.13 or less |
| Iodine consumption | t | 0.71 or less | 0.82 or less | 0.81 or less | 0.73 or less | 1.10 or less |
| Suspended solids | t | 5.49 or less | 3.21 or less | 3.78 or less | 3.96 or less | 3.93 or less |
|
Amount of n-Hexane extract |
t | 0.02 or less | 0.02 or less | 0.05 or less | 0.37 or less | 0.00 or less |
| Phosphorus content | t | 0.06 or less | 0.06 or less | 0.07 or less | 0.08 or less | 0.07 or less |
Locations covered: Tokyo Seimitsu Co., Ltd. Hachioji Plant
Environment・Society・Governance


